ECG made really easy

  • Post author:
  • Post category:ECG

In med school we were taught about the Einthoven’s triangle. For an ECG purist, its the best explanation – however to workup and analyze an ECG its not the easiest. So instead of the triangle lets look at the easiest construct that we can use to analyze and interpret ECGs. Most of you already know this – but I would like to refresh it here.

An ECG lead is basically a view to the heart’s electrical activity from a given angle. This view represent the summation of all electrical activity of the heart as seen from that angle at a given moment.

We have 12 leads which look at the heart and 6 of them are arranged in the horizontal plane (the limb leads)  and the other 6 around the chest (precordial leads)

Any electrical activity coming towards the lead (the view) will lead to a positive deflection and any activity going away will lead to a negative deflection

ECG - limb leads
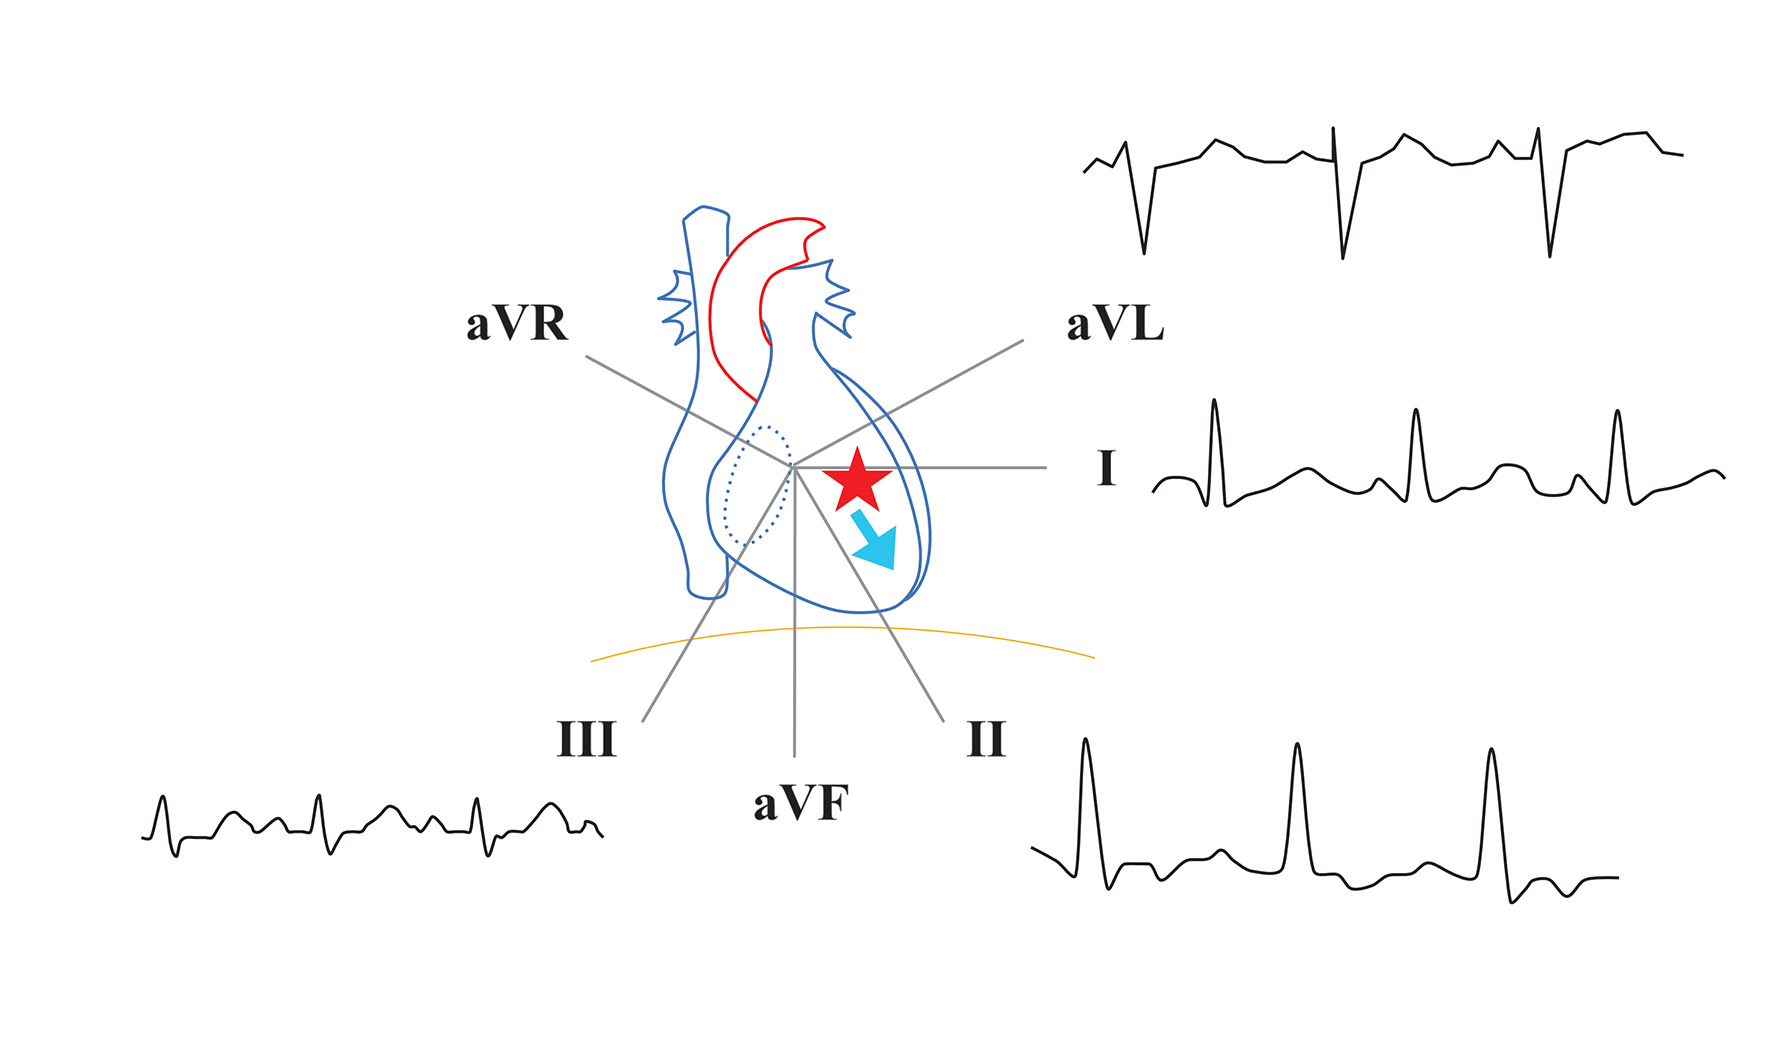
Limb leads as seen on frontal plane. A lead represents a view of the heart's electrical activity from a particular direction. Leads II, III, aVF see the heart from the bottom (legs) and therefore are termed inferior leads. Lead 1 looks directly from the left lateral side. Lead aVL also looks from the left side but is a bit superior - i.e. looking down from the left shoulder. aVR looks from the right shoulder down towards the heart.
ECG - precordial leads
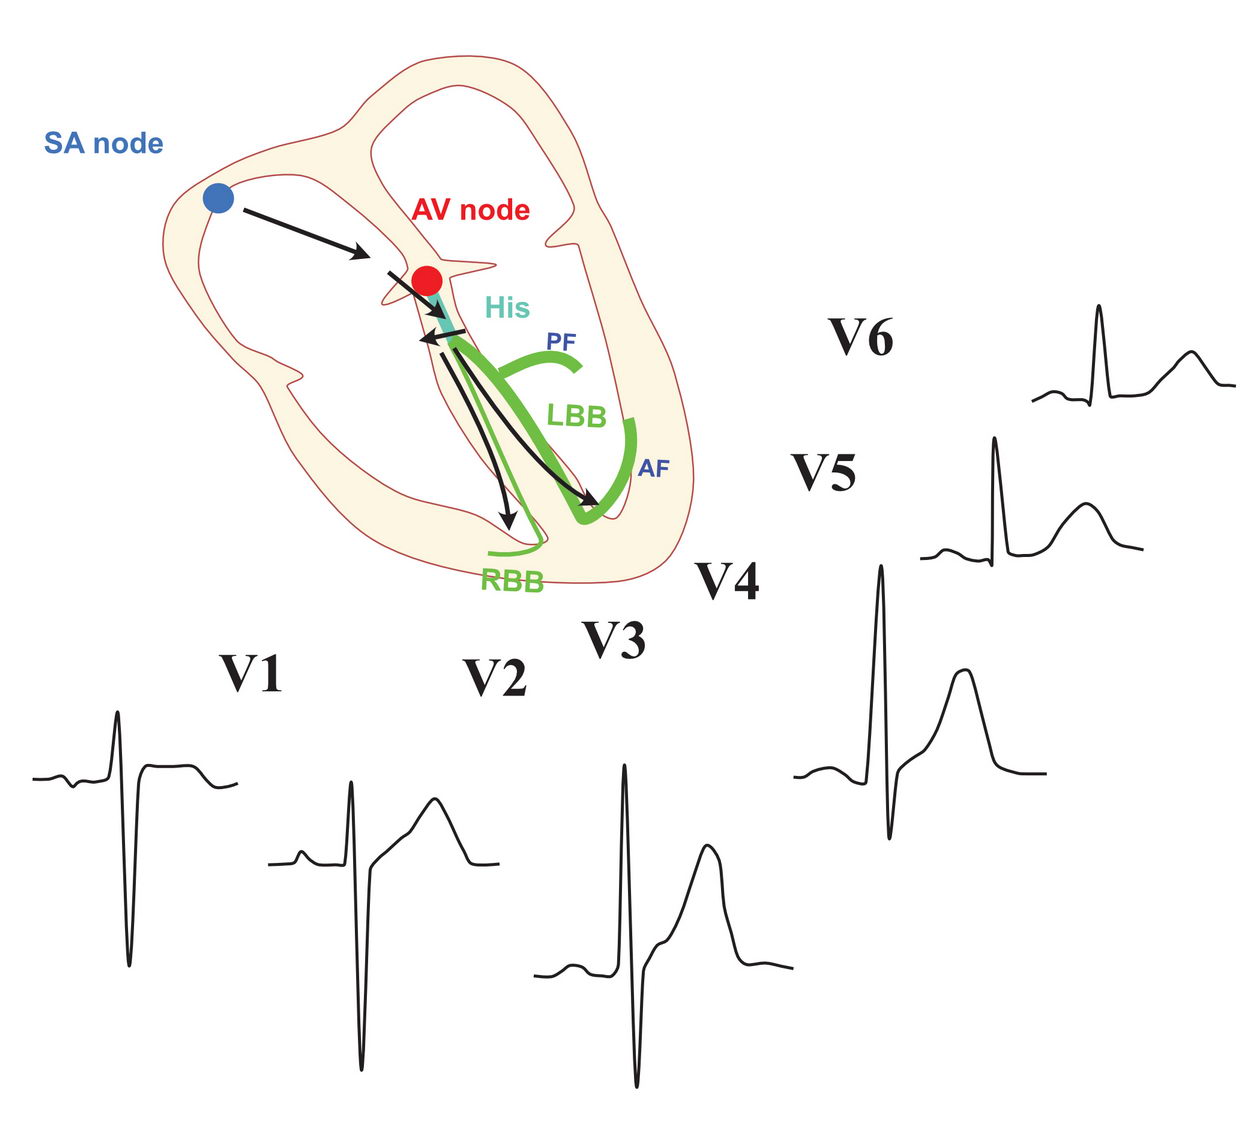
The precordial leads. These leads from around the chest towards the heart in the horizonatal plane (i.e. as if the body was cut across the heart in the horizontal plane). V1 is the only lead looking from the right side. V2 and V3 look at the septum. (Of course the septum is seen 'through' the RV - but as the RV muscle mass is much less, the septal muscle dominates the the signal on V2 and V3. The combination of V3 and V4 face the anterior aspect of the heart - again dominated by the left ventricular anterior wall. V4 and V6 look at the anterior wall from the left lateral side and therefore are called lateral precordial leads. Not shown in this picture are the right side V4 and V5 - which are sometimes take to look at the right ventricle.

These two are the most useful constructs to work out an ECG. Although its highly simplified, it actually works out well to analyze the ECG. Lets see how the normal ECG looks using this setup.

Genesis of the normal ECG - limb lead activation pattern
Genesis of the normal ECG in limb leads. The sinus wave originates in the extreme right and upper part of the heart (RA) and travels towards the left side and downwards to reach the AV Node. Therefore the P wave is upright in inferior leads, best seen in lead II. The p wave is negative in in aVR as it is directly in opposite direction. It is also positive in lateral leads. Once the signal reaches the His bundle, it travels via the bundle branches in to reach the ventricles. Therefore the inferior leads have dominant positive QRS complexes. Lead I is also positive as the dominant wave is towards the left side. aVL is usually positive but sometimes postivie-negative or negative depending on the cardiac rotation. The septum itself is depolarized from left to right. aVR is always negative as it is directly opposing the direction of the wave. The septum it self depolarizes from left to right - leading to small septal Q waves in lead I and aVL.
Genesis of the normal ECG - precordial lead activation pattern
Genesis of the normal ECG in precordial leads. In this view, the sinus node is the right most structure and therefore the P negative in V1 (because the atrial depolarization is traveling towards left side, against the right sided V1). From V2 onward the P wave is positive as the wave is coming towards the left sided precordial leads. Occasionally, the P wave is biphasic (positive negative) in V1. This is because, the left atrium is a posterior left-sided structure and the sinus wave depolarizes it from right to left (hence the second component negative). The QRS component is dominantly positive in left-sided precordial leads (progressively becoming positive from V2 to V6). The V1 is usually negative - because its a right sided lead looking at the dominant left ventricle. Regardless, a small R wave is seen on V1, owing to the contribution by the RV - which depolarizes towards V1. The septal Q wave is best seen in lateral V5 and V6

As you can see most of the ECG can be easily worked out having in mind where the lead is looking at the heart.

It is also very important to keep in mind, that certain things on the ECG cannot be explained by this model – thats because we have really simplified the complex 3D shape and position of the heart.

As electrophysiologists the distinct advantage that we have is – our knowledge of cardiac structural anatomy – so we need to put little details of anatomy to the picture to understand some things happening in the ECG.

For example, in the normal ECG, one cannot explain tiny Q waves in inferior leads using this picture – because we have conveniently forgotten the outflow tract septum  – which is depolarized upwards. However when we do factor it, it becomes readily apparent.

Therefore application of relevant anatomy is crucial in analyzing certain ECGs.

In the relevant sections, these are discussed (e.g. identification of location of accessory pathways, analyzing P wave origin in atrial tachycardia, analyzing QRS complexes to locate VT etc….

ECG - cardiac axis in limb leads
Cardiac axis in the frontal plane. For EP, the most practical reason of working out a specific axis is to rapidly identify various clinical bundle branch syndromes (e.g. trifascicular block). Apart from that we are not that keen on the specific axis - we need to figure out the direction of the wavefront on the frontal plane to locate various arrhythmia foci. (along with the precordial leads)

In this section, we will see how to localize things to the correct site of an ventricular arrhythmia focus by working out the ECG – not by pattern recognition. This is a fundamental concept to master as very often we need to know which chamber to go after to sort of out EP problems. Once we do this, we can easily figure out the main bundle branch block types – would be discussed later.

Using the frontal plane

In the frontal plane (limb leads), one common zone of reference is the inferior leads (II, II, aVF). If all of these leads are positive, that implies something coming form above. The commonest example, being – ouflow tract ventricular ectopics. These originate in the ouflow tracts (i.e. near below the pulmonic and aortic valve) and are directly coming down towards the main body of the ventricle – therefore all of these leads would be positive. In contrast, if an ectopic is coming from the base (bum) of the heart, they would be traveling upwards to the main body of the ventricle – thus inscribing negative waves on the inferior leads.

This top -bottom differentiation using inferior leads should be the first step. Once that has been done, the other leads can be used to fine tune the location. if aVR and aVL are both equally positive, then a very midline focus in the bottom is likely and the the inferior leads too should be equally negative. For stuff coming from the top it would be the opposite. If the lead III is more negative compared to the other two, then something from the RV base may be coming up and correspondingly, aVL should be more positive than aVR.

What about stuff from the middle of the ventricles?. If there is a focus on the left lateral wall (e.g. after a left lateral MI) leads I and aVL will be negative. Depending on the direction, lead III may be positive. In contrast a septal focus would make lead I positive as the wave would be traveling leftwards.

Lets look at some examples how we can use the limb leads to see where impulses are coming from

Workign out the ECG - genesis of the limb leads from a focus in the base of the right ventricle outflow tract
In this ECG, there is a focus firing from the right ventricular outflow tract. Since its a very superior position in the middle the inferior leads are equally positive and the left and right limb leads are equally negative.
Workign out the ECG - genesis of the limb leads from a focus in the base of the right ventricle
In this ECG, the focus is on the base of th heart and therefore the inferior leads are negative as the wave is traveling upwards. Looking at aVL and I we can further fine tune it to the right side base as lead III is more negative compared to aVF and II along with positive aVL.
Workign out the ECG - genesis of the limb leads from a focus in the left lateral LV
In this ECG, the focus is on the left lateral side of the ventricle. Therefore lead I and aVL are negative. Since the wave is going towards the right side - aVR and and III are positive. aVF is small because the direction is parallel to aVF

Now lets look at the precordial leads and see how they help with the ECG diagnosis. For EP, the main use of the precordial leads are to assess the left / right of a arrhythmia focus  – i.e whether its coming from a left side chamber or right side chamber.

The most crucial fact to remember is that in the standard 12 lead ECG, V1 is the only precordial lead looking at the heart from the right side.

Therefore dominant positive deflection on V1 implies that something is coming towards it – from the septum or the left side

Conversely, V6 is at the other end and any dominant positive deflection on it implies that something is coming towards it – from the right side or the septum.

Workign out the ECG - genesis of the precordial leads from a focus in the right ventricle base
This diagram shows what happens to the precordial leads when there is a focus firing from the RV. As expected, V1 is negative and V6 is positive. Due to the rotation of the heart and the placement of the leads, there is transition point in V3/V4 where the QRS complex has equal R and S waves
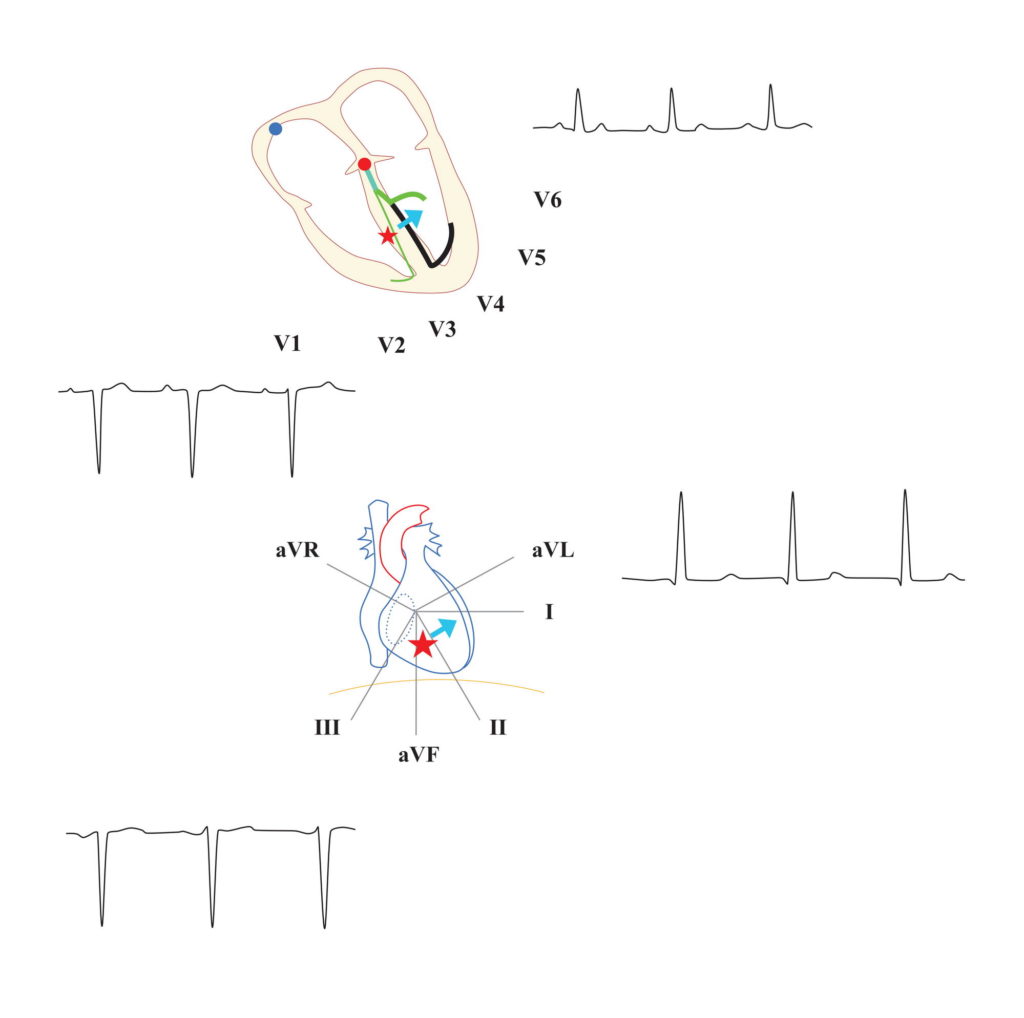
Workign out the ECG - genesis of the precordial leads from a focus in the left ventricle base
This diagram shows an LV based focus firing off. As expected, V6 is negative and V1 is positive.

Now for a moment forget spontaneously firing foci. Just imaging that there is a heart with the left bundle branch not working. Can you workout the ECG?

Workign out the ECG - genesis of the precordial leads during left bundle branch block
Working out the pattern of left bundle branch block in the precordial leads. Since the left bundle is not working, the right bundle terminus is the first point of activation in the ventricles. Thereafter the impulse travels intra-myocardially to the left side and and activates the left ventricle. Therefore V1 has a negative deflection and V6 has a positive deflection
Workign out the ECG - genesis of the limb leads during left bundle branch block
Working out the limb lead pattern in the ECG during LBBB. As we worked out the precordial leads, the activation of the ventricles begin in the right side and travel towards the left side. Based on the orientation of the limb leads - aVL is strongly positive and lead III is strongly negative. The same pattern also shows that the cardiac axis is now left axis deviation.
Workign out the ECG - genesis of the precordial leads during right bundle branch block
Precordial ECG pattern in Right Bundle Branch block. In this situation, the ventricular activation begins in the left side and travels towards the right side as the working bundle is the left bundle. This results in a tall V1. We expect a negative V6 but in reality because of the septal to lateral wall activation in the LV - V6 is also usually positive - but definitely has a S wave indicating that there is a component of activation going towards the right side. Sometimes (as in this example) there can be notching in V1 leading to the so called RSR pattern. This is because again the differential depolarization of the septum versus the left lateral wall. But net wave is still towards the right - so V1 always positive.
Workign out the ECG - genesis of the precordial leads during right bundle branch block
Limb leads in RBBB: We expect there to be right axis deviation as the ventricles are getting activated from left to right. But in reality, the LV has a huge mass compared to RV and since the LV is getting properly activated by both left anterior fascicle and left posterior fascicle, the LV activation is towards the apex and is not changed much by the low voltage activation of RV towards the right. (in LBBB, the bulky left ventricle is on is entirety is getting activated from right to left via the septum, anterior and posterior walls - therefore there is left axis deviation). Therefore in isolated RBBB the axis remains normal or only slightly deviated to the right. If there are other causes for RAD, then the axis will become right deviated. They include RV hypertrophy (e.g. Pulmonary hypertension due to congenital heart disease - where RBBB is also common), concomitant bi-fascicular block with a block in the left posterior fascicle where the LV activation begins on left wall by the remaining anterior fascicle. In contrast to limb lead III, V1 is in a better position to record the LV to RV activation of RV so on precordial leads, V1 is dominantly tall in RBBB

Now lets try to figure out fascicular blocks. This area “Sounds difficult” and there is lot of confusion – but once you understand the principles, it is very simple to work it out.

First let’s look at monofascicular blocks (blockage of single fascicle on left branch)
ECG of Left Anterior Hemiblock
ECG of Left Anterior Hemiblock (LAHB). Left anterior fascicle supplies the anterior and lateral walls of the LV. When it is not working, basically the LV gets activated from the posterior fascicle and the RV. Therefore the cardiac axis is left axis deviation. Since the LV is still siginifcantly activated by the posterior fascicle, overall conduction time is not that impaired (about 20 ms) - so the QRS width not that wide as per a typical major BBB. In fact the only evidence may be a left axis deviation which cannot be readily explained (e.g. presence of LVH). LAHB occurs due to degenerative or acquired insults to the anterior fascicle and are usually seen in adults with diseased hearts.
ECG of Left Posterior Hemiblock
ECG of Left Posterior Hemiblock : Left posterior fascicle provides the inferior part of the LV. Therefore the lack of it causes and unbalanced left lateral wall activation in the LV via the anterior fascicle. This wavefront travels towards lead III - thereby creating a right axis deviation. The intact right bundle maintains proper RV activation and therefore in the precordial leads, V1 will be negative as per normal heart. QRS width is only slightly increased (20ms) as only one fascicle is not conducting. As LAHB, this occurs in diseased hearts and the only ECG manifestation may be unexplained right axis deviation.

Therefore bifascicular blocks are either:

  • Unexplained left axis deviation and RBBB (LAHB + RBBB)
  • Unexplained right axis deviation and RBBB (LPHB + RBBB)

The clue to the fascicular block is the axis deviation – which needs to be unexplained by other causes – e.g. like ventricular hypertrophy as these are common explained causes of axis deviation rather than a true fascicular block.

Accepted true Trifascicular block is either:

  1. 3rd degree AV block + RBBB + LAHB
  2. 3rd degree AV block + RBBB + LPHB

Note :  the common clinically referenced tri-fascicular block – RBBB + First degree AV Block + LAD is a misnomer and should not be used (as this is a bifascicular block with AV nodal block – not true trifascicular block)

Sometime it is not very clear and there are other ECG features to look for in fascicular blocks – I don’t want to put them here as it would be confusing and my goal above is to make clear how to work out the ECG. The best clinical ECG reference on the internet to learn these are : Life in the Fast Lane (ECG)